Web-based charting built by traders, for traders
A lightweight, browser-based charting platform with orderflow footprint charts, tick-by-tick backtesting, trading journal, and performance analytics. No downloads, no heavy hardware. Just open your browser and trade.


Judge for yourself
who has the real advantage
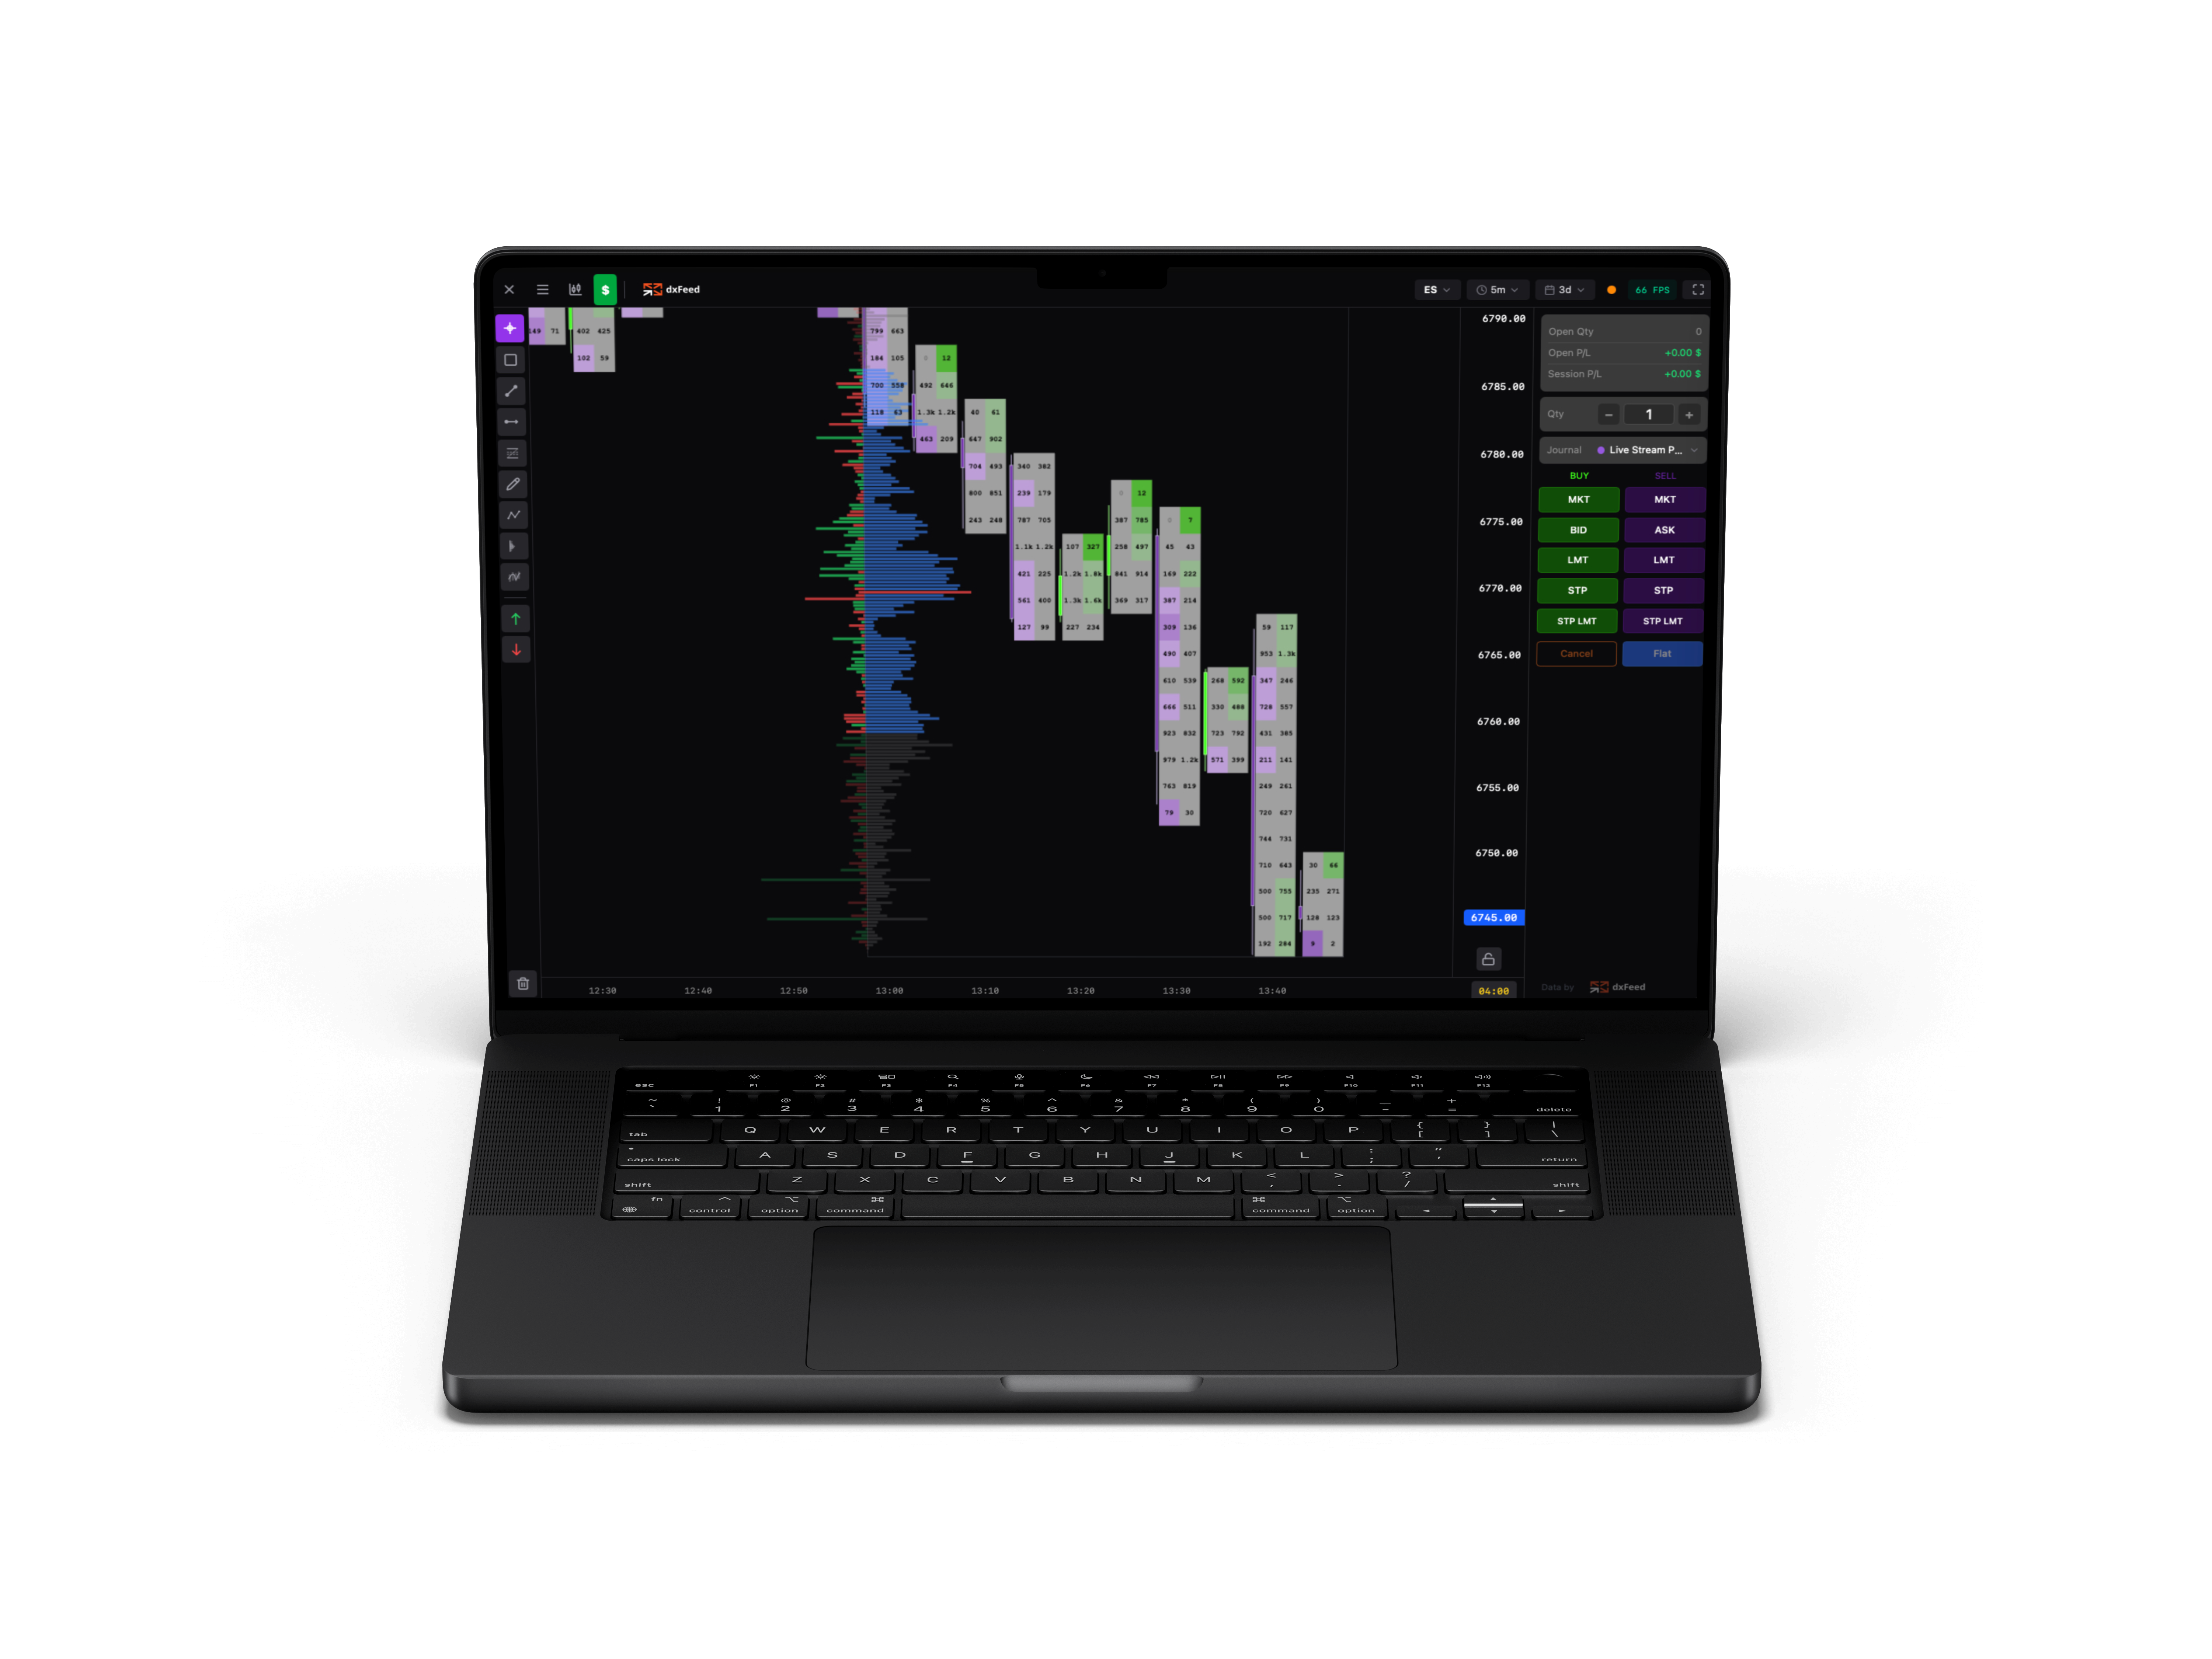
Tick-by-Tick Backtesting
Replay any trading day at 1x-50x speed. Every trade that happened on the market is captured from Time and Sales data and displayed tick-by-tick. Practice reading absorption, exhaustion, and stop runs without risking capital.
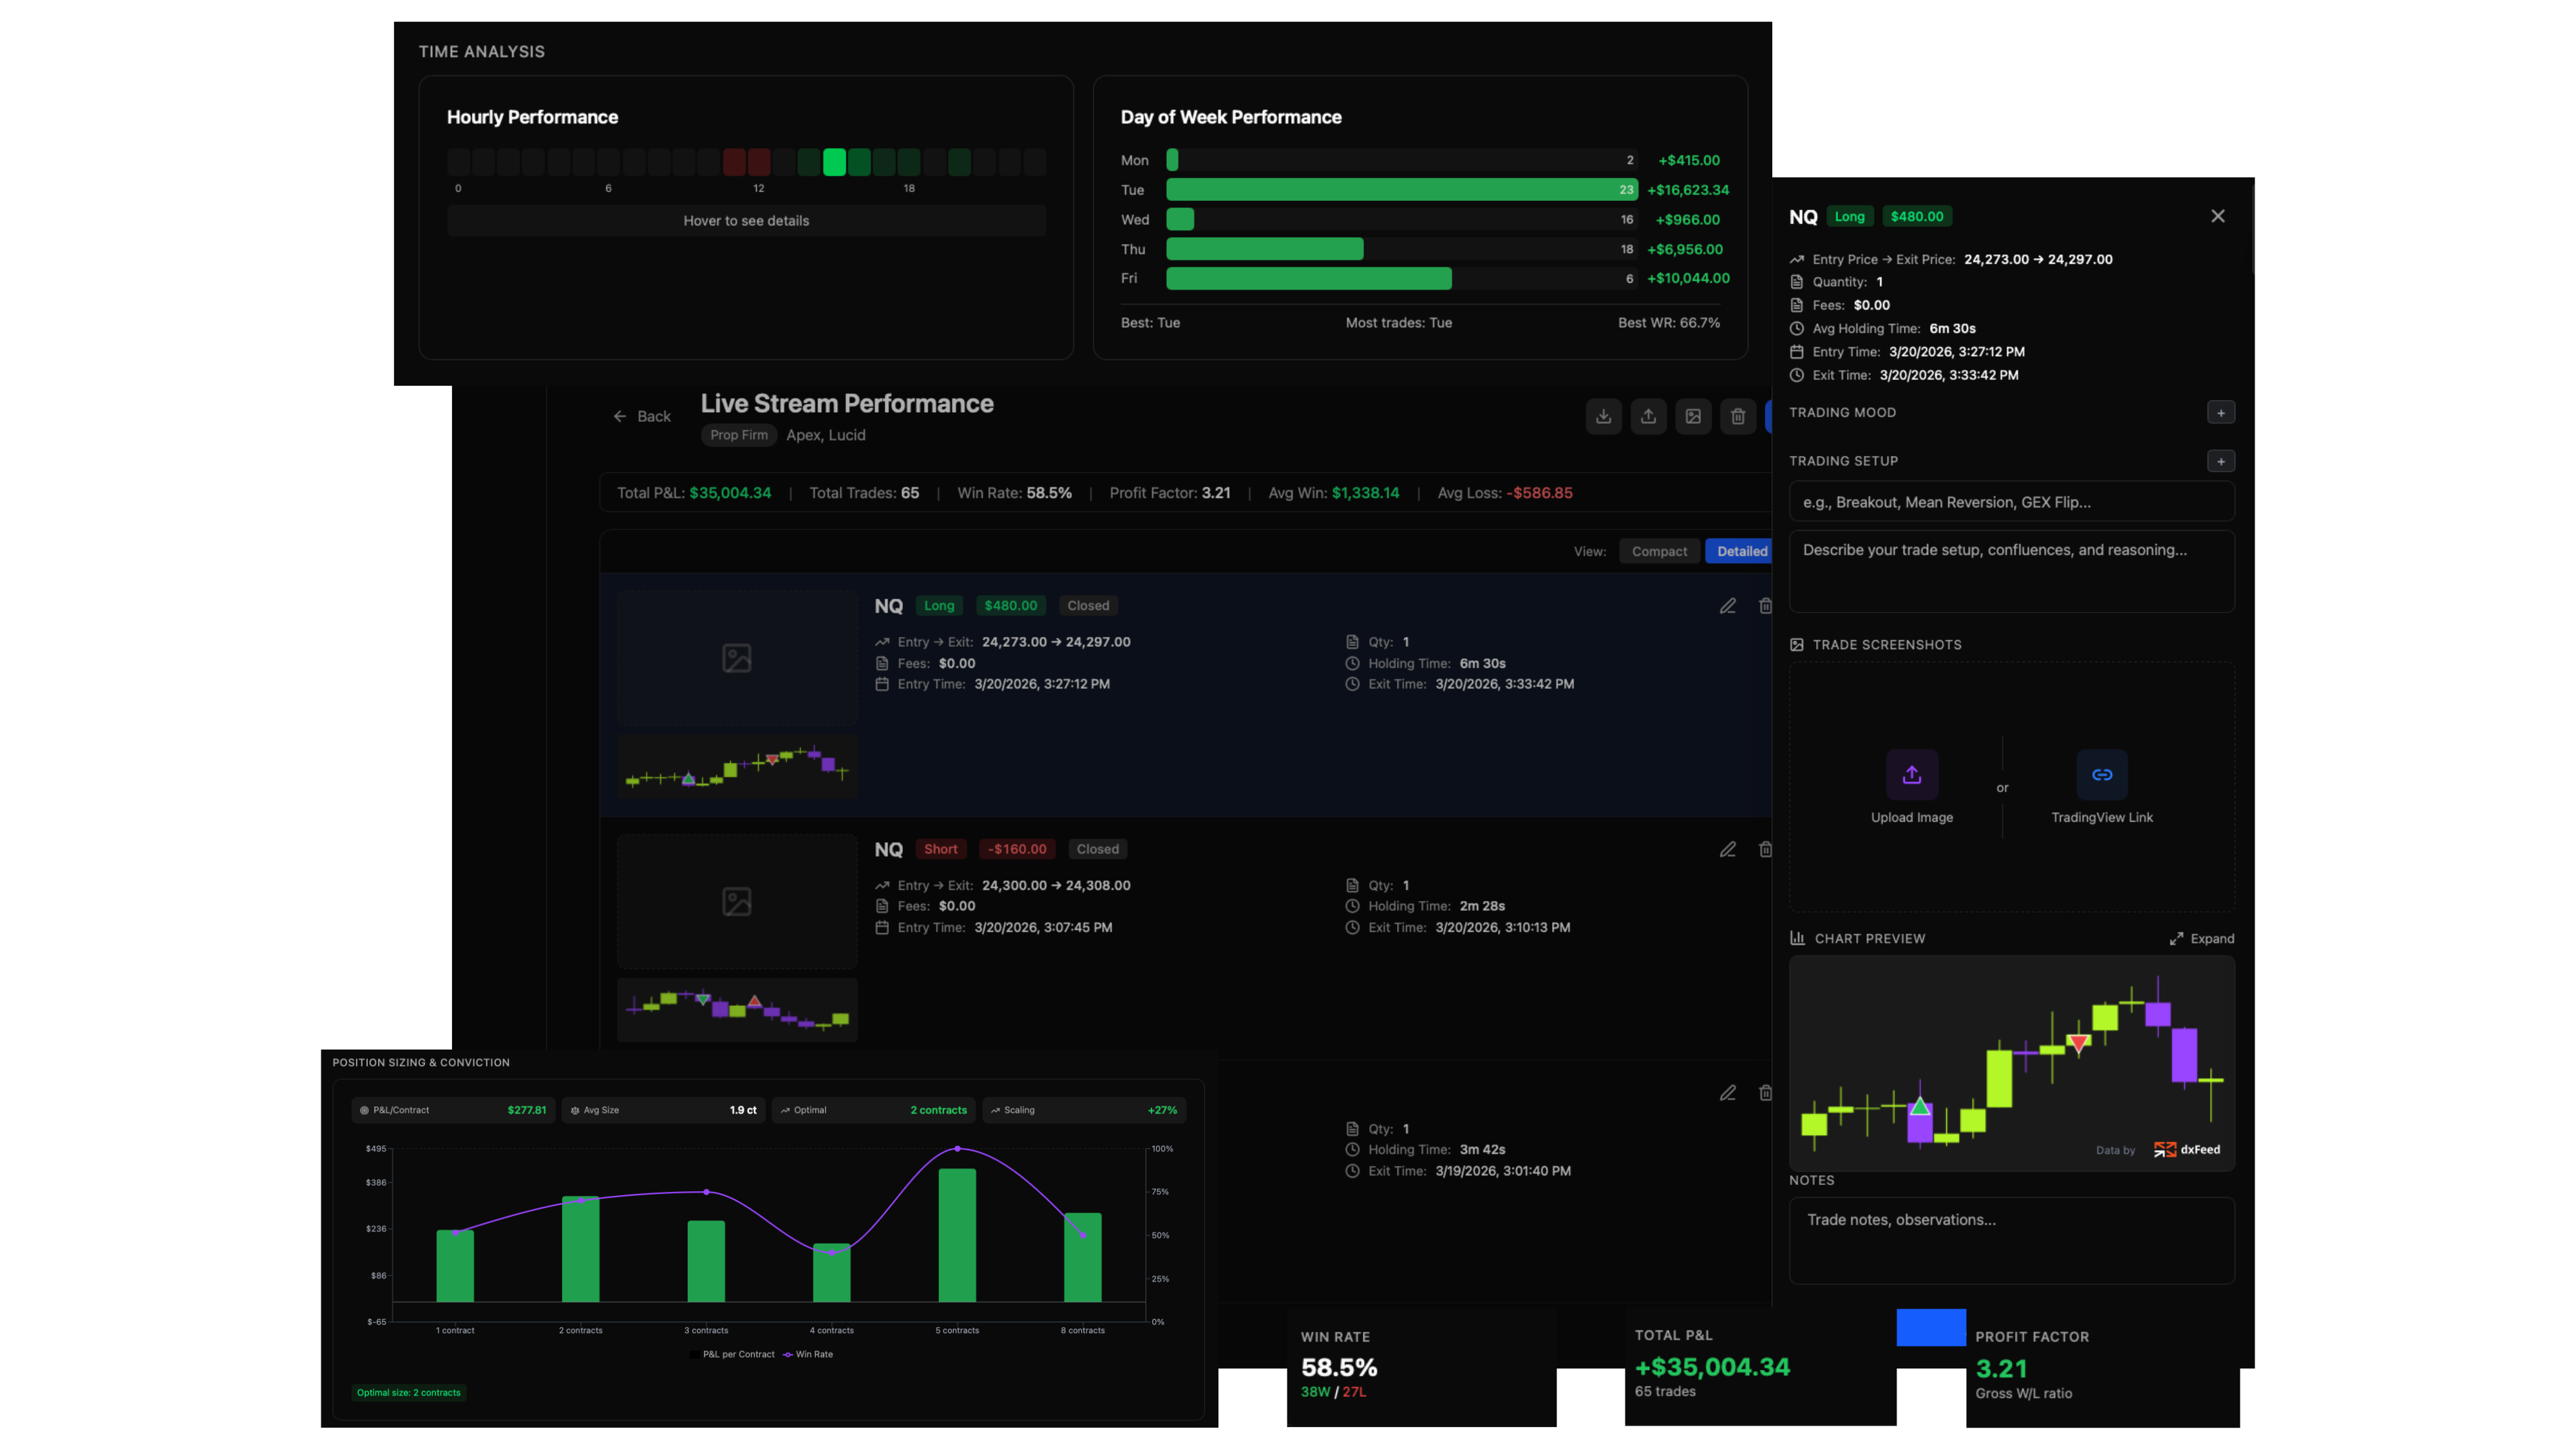
Journal & Analytics
Every trade automatically linked to the chart at that moment. Track entries, exits, MFE/MAE. See your win rate, R-multiples, drawdown curves, and time-of-day performance. Know exactly where you make and lose money.
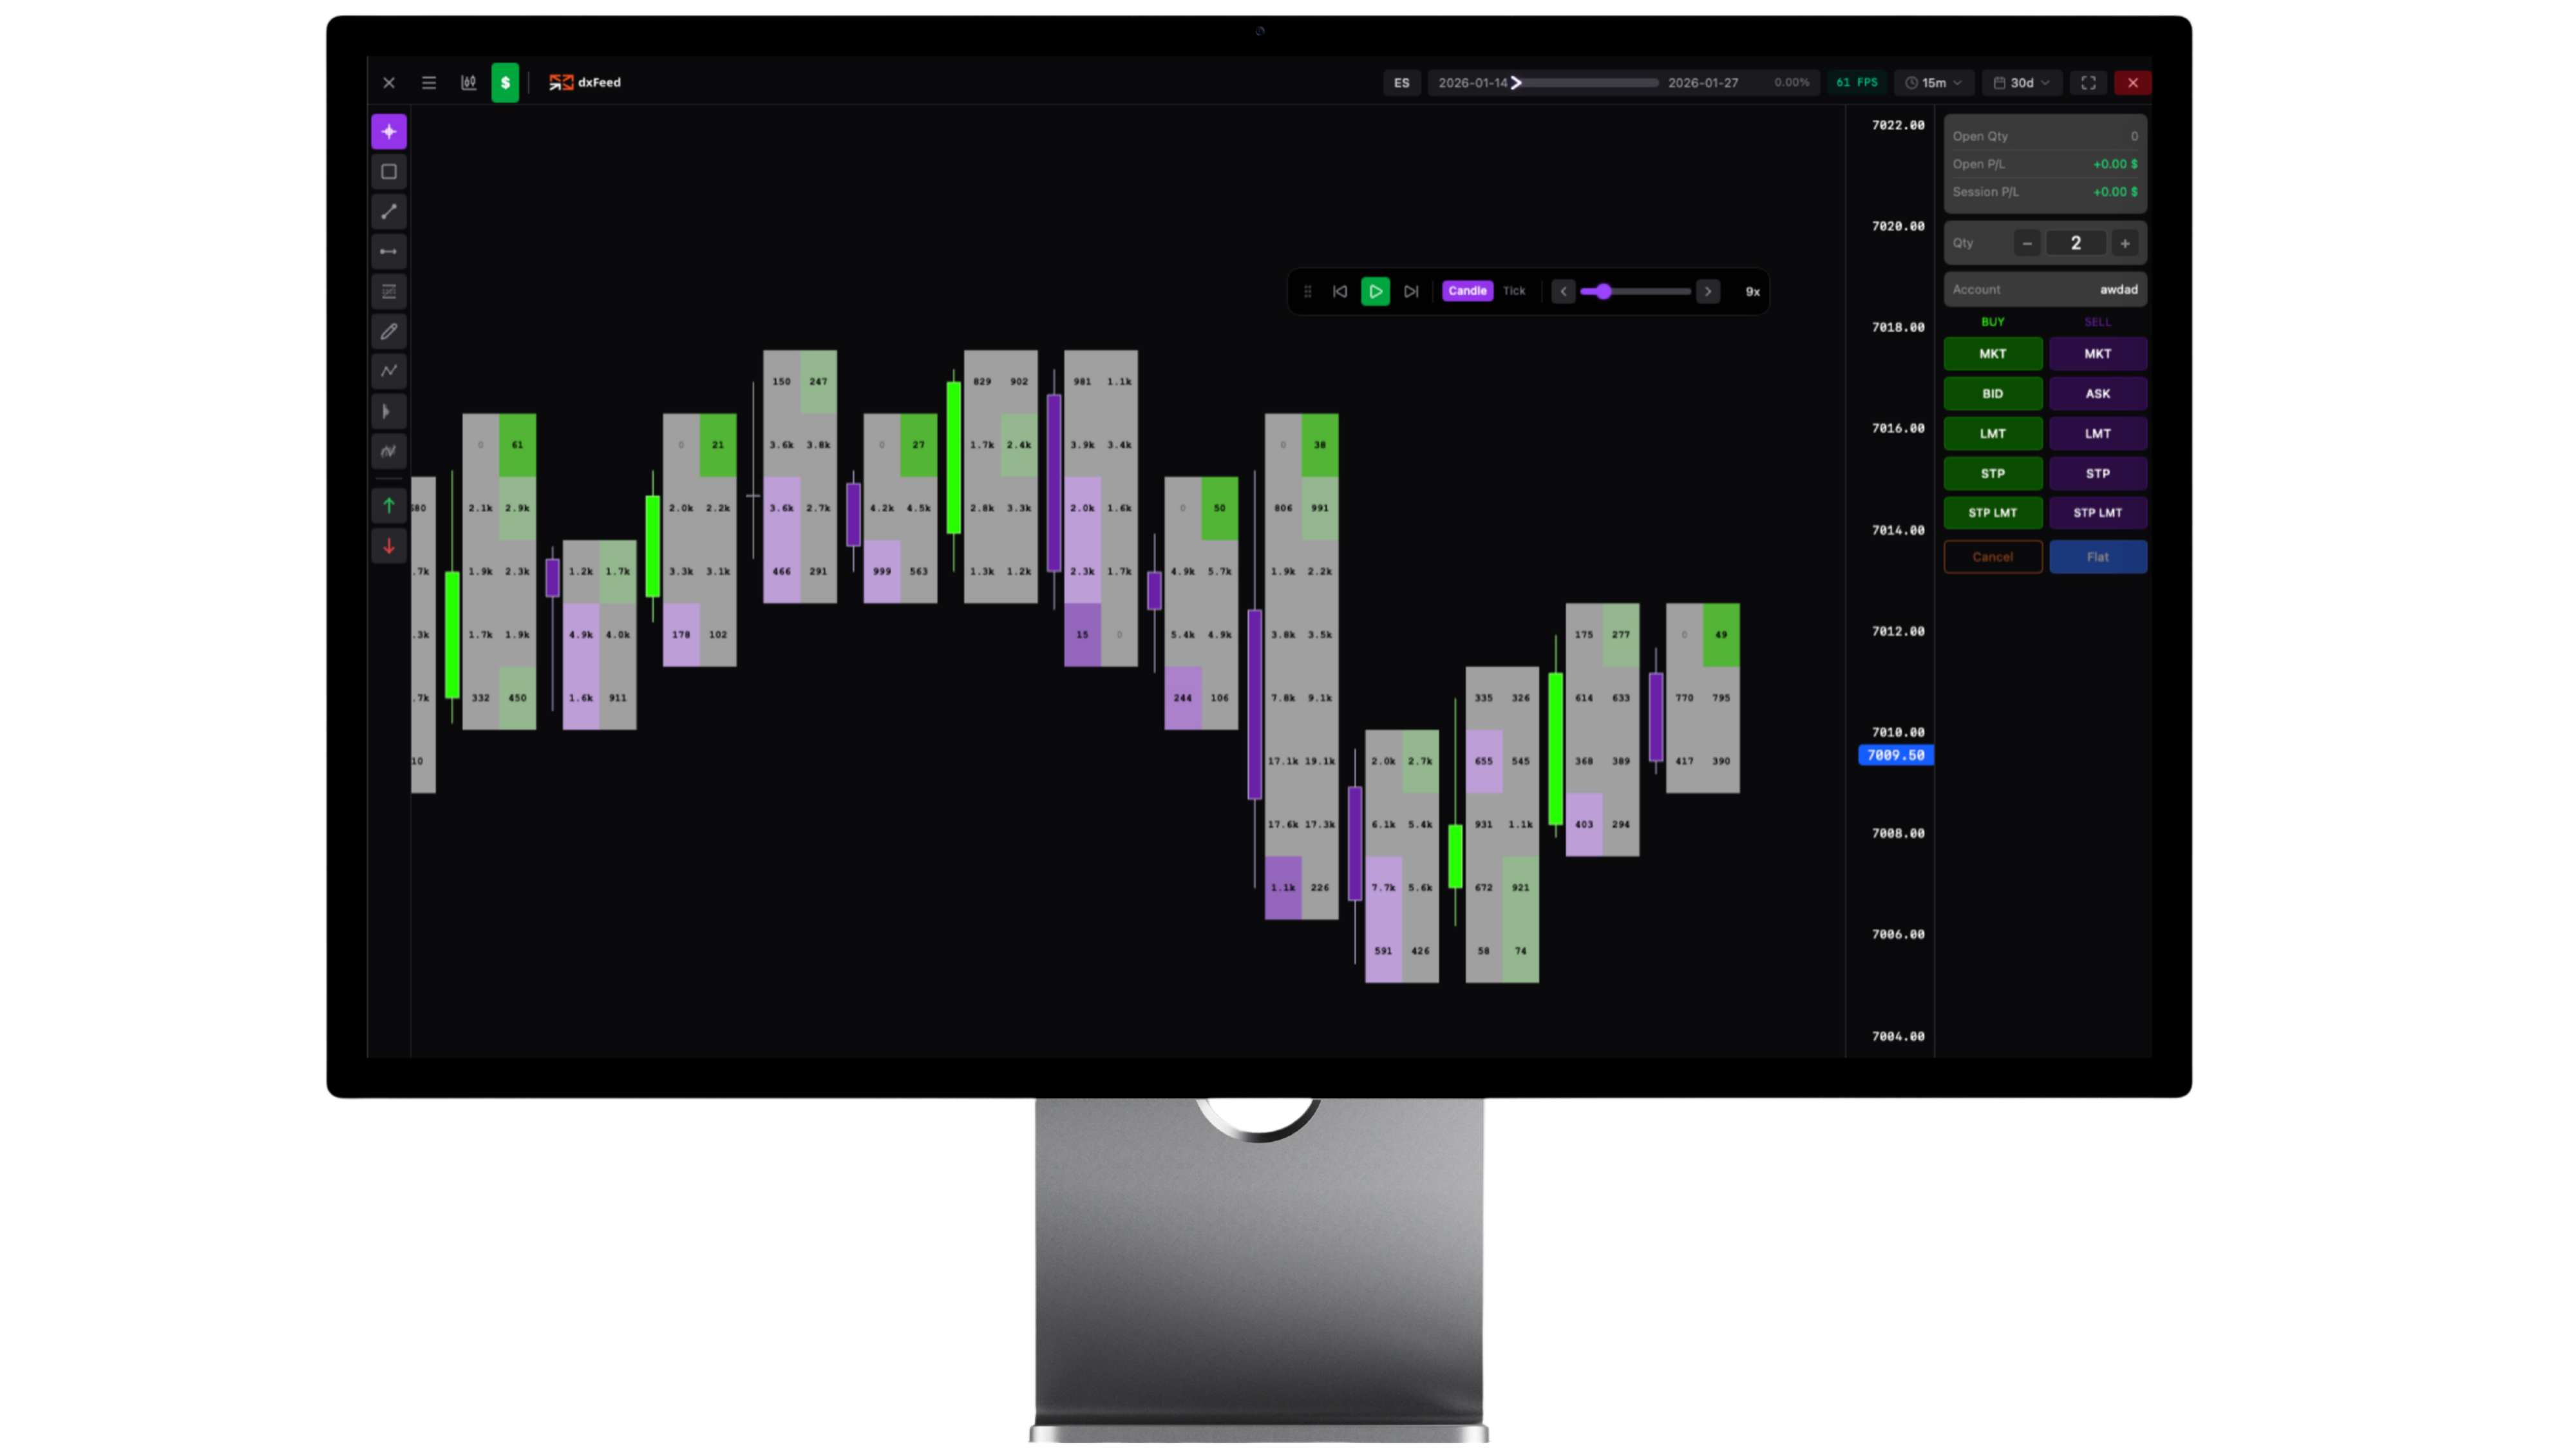
Live Market
Stream real-time footprint data directly in your browser. Paper trade with bracket orders and record your sessions for later replay and review.
Lighter. Faster. Better.
Built for any machine
“Finally a charting tool that doesn't lag with footprint data. The WebGL rendering is incredibly smooth. I can scroll through weeks of tick data without any stutter. Nothing else comes close.”
Martin K.
Futures Trader
“The backtesting replay changed my game completely. I practice reading orderflow patterns every evening. My win rate jumped from 42% to 58% in two months.”
Petr S.
Day Trader
“Runs perfectly on my ThinkPad from 2020. Other platforms would freeze with this amount of data, but XF Charts is buttery smooth. The journal integration is brilliant too.”
Anna H.
Prop Firm Trader
“Volume profile analysis is top-notch. Naked POC extensions and HVN/LVN markers help me find key levels instantly. Way better than paying $200/mo for ATAS.”
Tomas N.
Swing Trader
“Switched from Sierra Chart for backtesting. Speed difference is night and day. Loads a full day in 2 seconds, used to take 30. And it runs in my browser!”
Jakub D.
Scalper
“The performance stats blew my mind. Time-of-day analysis showed I was losing money in the first 30 minutes consistently. Now I wait and my PnL curve looks completely different.”
Lukas M.
Algorithmic Trader
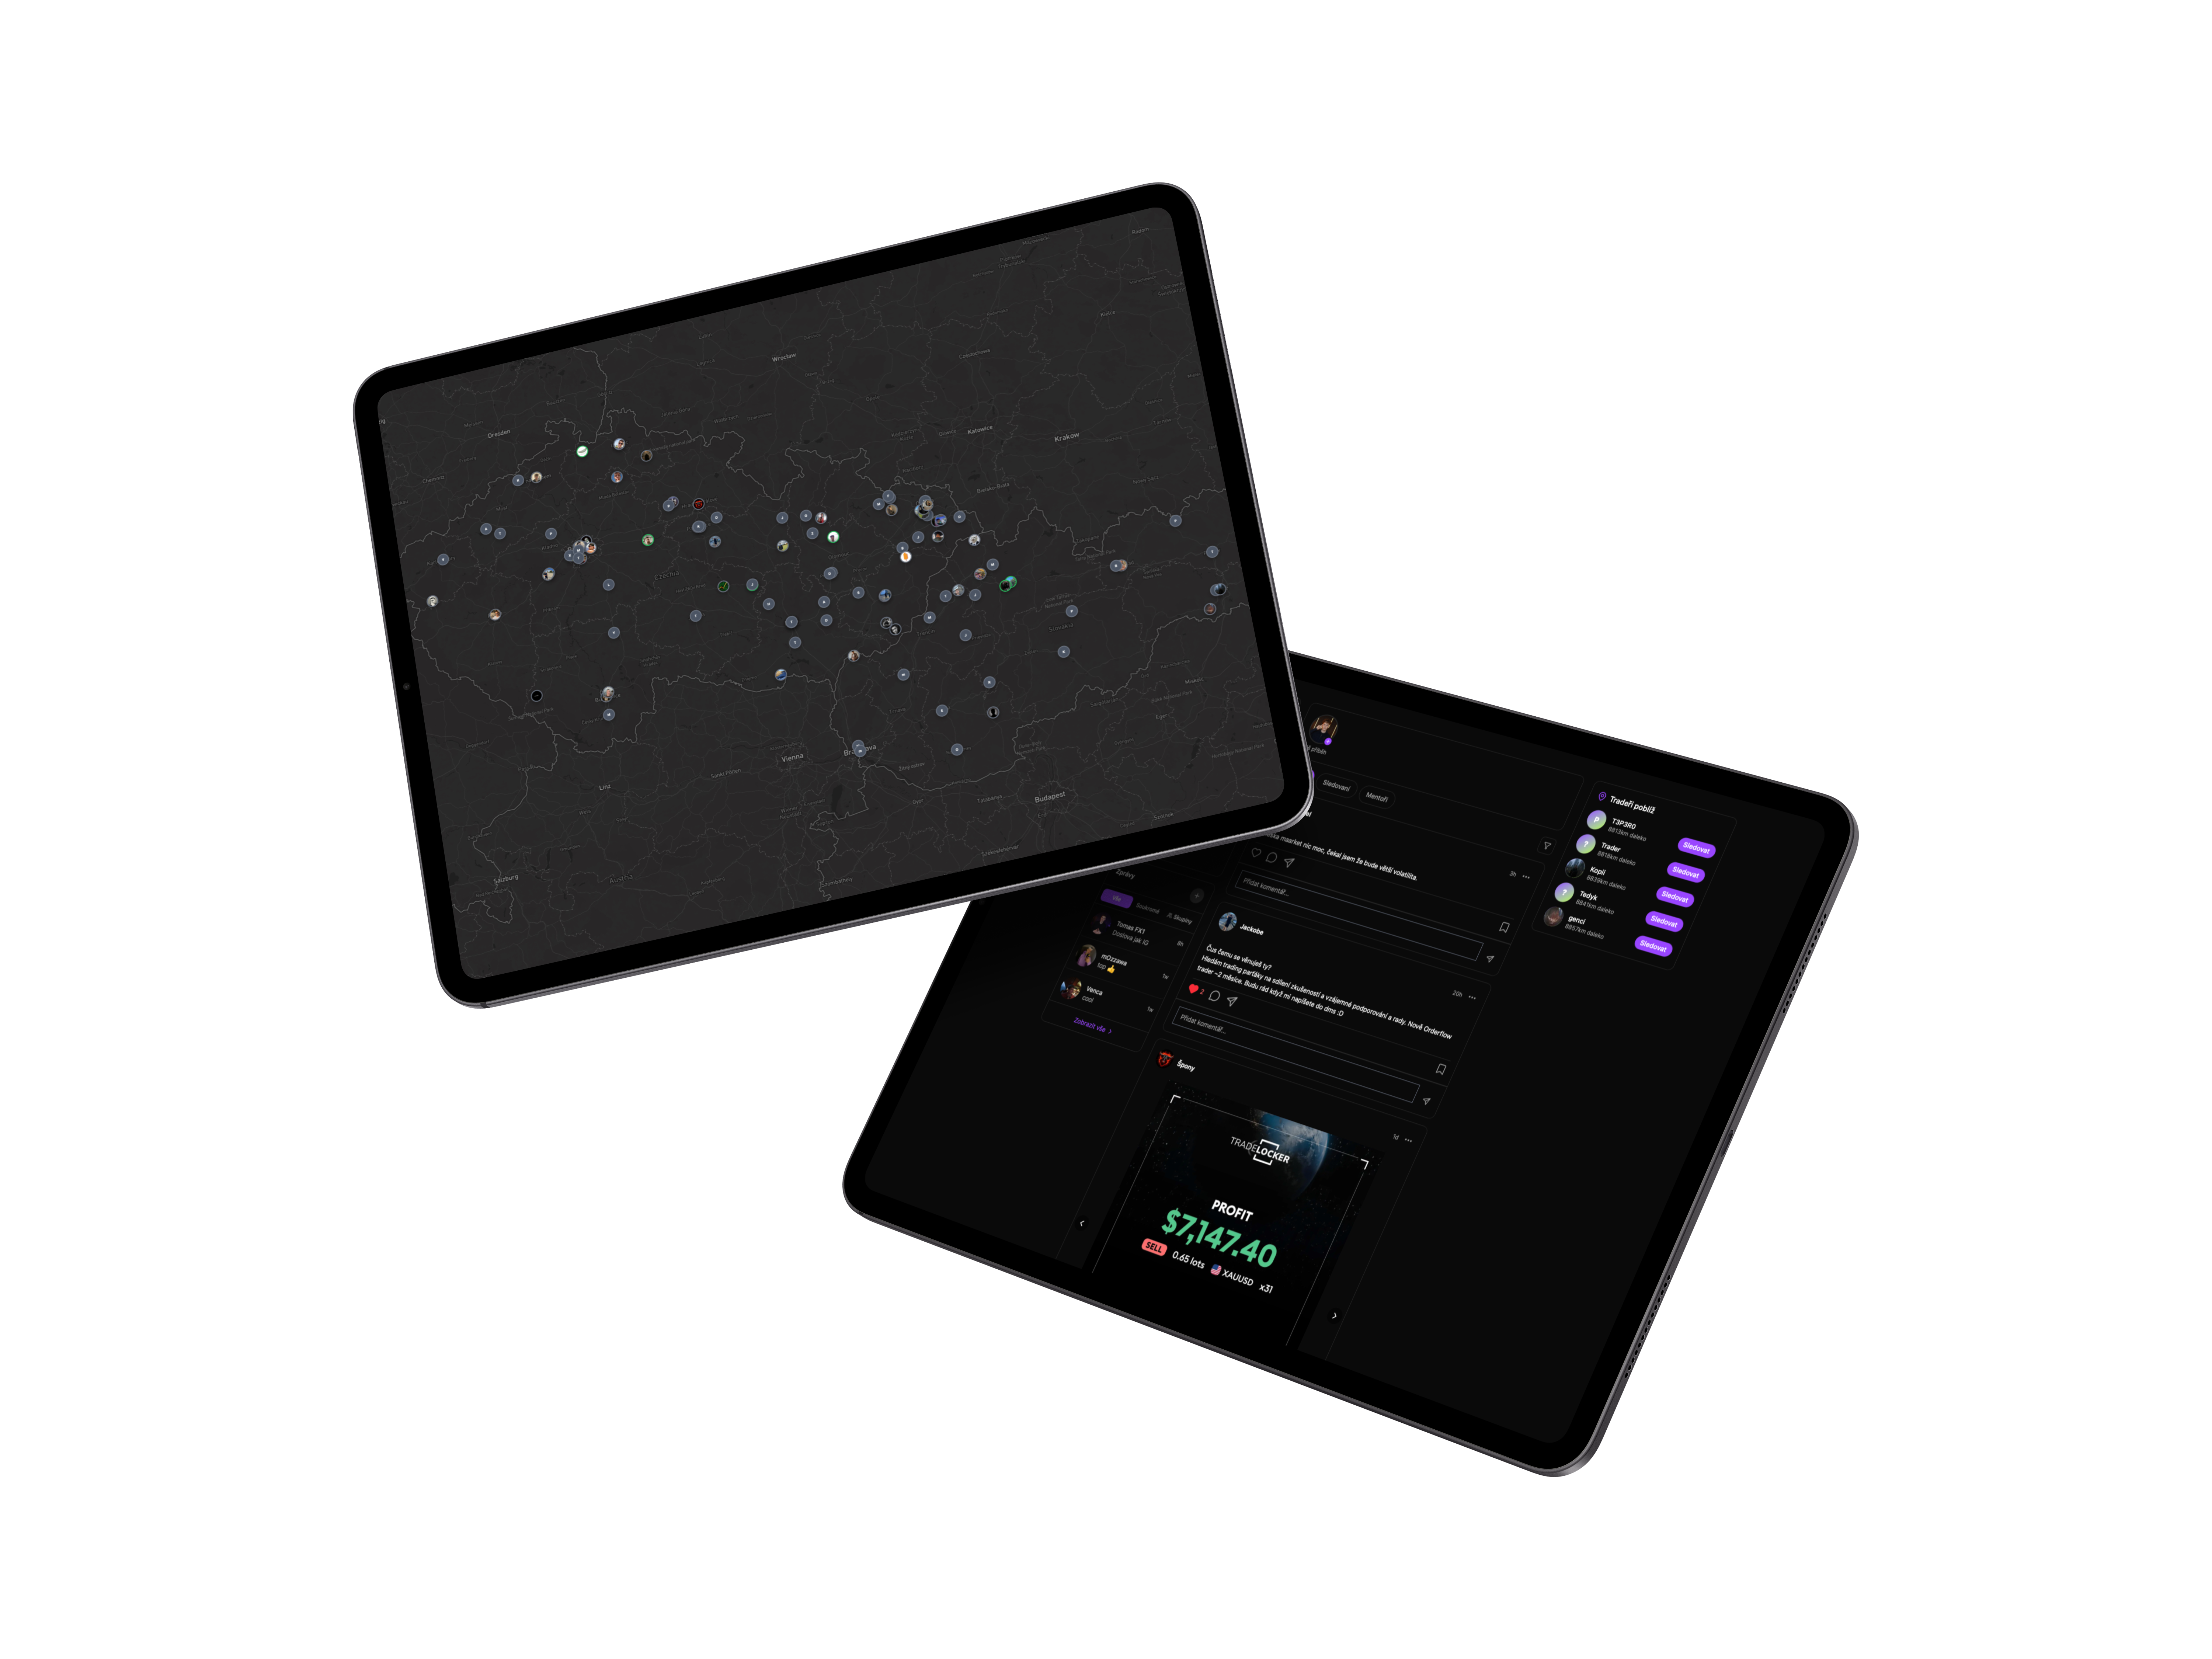
Backed by a trading community
XF Charts is built by XFlow Trading, a community of thousands of active traders. Access the XF Network with its social platform and networking map.
Simple pricing.
Full access, no limits.
One plan, everything included. Choose quarterly or save with annual.
Quarterly
Billed $87 / Quarterly
Annual
Billed $228 / Annually
Frequently asked
Everything you need to know about XF Charts. Can't find the answer you're looking for? Reach out to us.
Still have questions?
Contact usXF Charts supports all major US futures markets including ES (S&P 500), NQ (Nasdaq 100), YM (Dow Jones), CL (Crude Oil), and GC (Gold). We use dxFeed for institutional-grade market data.
No. XF Charts runs on modest hardware. 4GB RAM, any modern browser, integrated graphics. Our WebGL engine delivers 60fps even on machines that are 5+ years old. No desktop app to install.
Load any historical trading day, then replay it tick-by-tick or candle-by-candle at your preferred speed (1x to 50x). Practice identifying orderflow patterns, place paper trades, and review your performance. All without risking real money.
Yes! The Live Market Terminal streams real-time data with footprint charts, price alerts, and a built-in paper trading panel. Record sessions for later replay and analysis.
You need a market data subscription from dxFeed or Rithmic to use XF Charts. We connect directly to their feeds for both historical backtesting data and live market streaming. Data feed is not included in the XF Charts license.
Yes. If your prop firm uses Rithmic (Apex, Topstep, TradeDay, etc.), you can connect directly with your Rithmic credentials for live market data and order routing.
XF Charts offers two plans: a quarterly license at $29/month (billed $87 every 3 months) and an annual license at $19/month (billed $228 yearly, saving 34%). Both plans include full access to all features. Data feed subscription from dxFeed or Rithmic is separate.
Ready to trade smarter?
Join traders who chose speed, simplicity, and professional-grade tools.
Get Started